
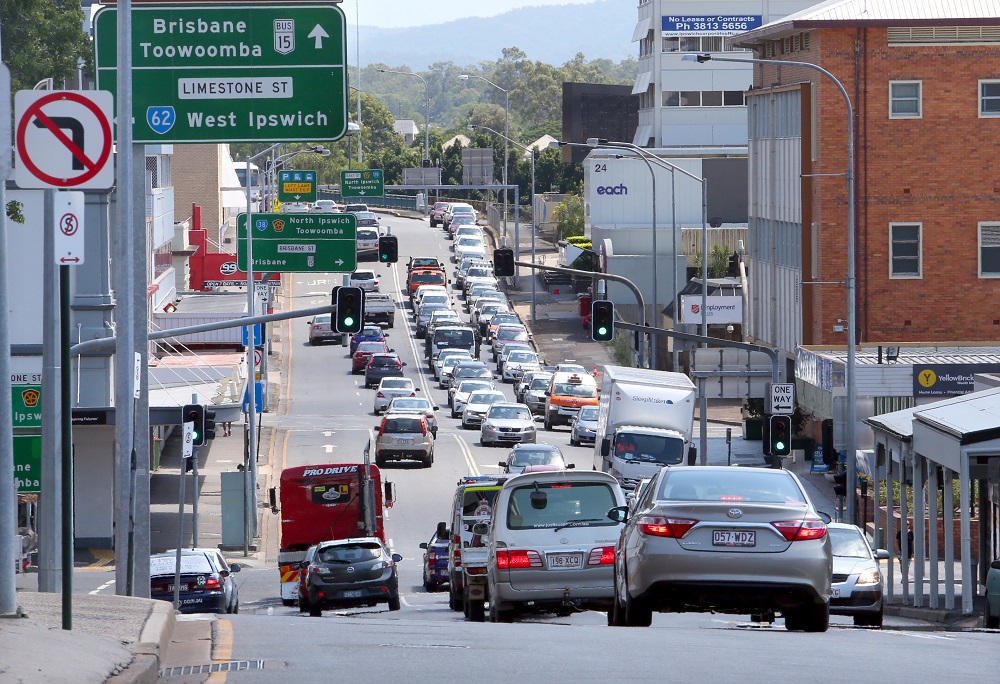
Ipswich continues to experience steady growth in traffic movements, indicating a heavy reliance on private vehicle travel.
Council’s 2018 Strategic Traffic Count Program revealed expected growth on our busiest, established roads and large increases in traffic in newly developed areas.
A total weekday volume of about 1.1 million vehicle trips were recorded during the 2018 program across 105 count sites.
The top nine busiest roads remain the same and in the same order as reported in 2017.
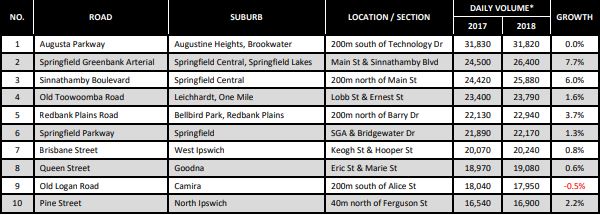
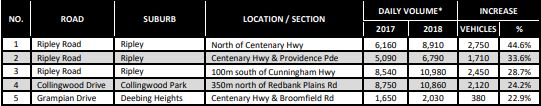
The largest increase in traffic over the last year (in terms of vehicle volume and percentage) was recorded on Ripley Road just north of the Centenary Highway, with an additional 2,747 vehicles per weekday – a 44.6 per cent increase.
Additionally, two of the other sites along Ripley Road also recorded large increases of 1,708 (33.6 per cent) and 2,446 (28.7 per cent) vehicles per weekday.
This is most likely the result of the continued development and construction works associated with the Ripley Valley Priority Development Area.
Collingwood Drive also recorded a significant increase of 2,116 (24.2 per cent) vehicles per weekday.
This growth and the results recorded in the surrounding area, suggest the continuation of the Eastern and Outer Eastern Suburbs traffic redistribution as outlined in last year’s report.
This being, increased north-south movements on strategic roads in the area throughout 2017 and 2018, as opposed to the east-west growth observed on strategic roads in prior years.
Infrastructure Services chief operating officer Charlie Dill said Ipswich overall recorded an increase of 4 per cent in the number of traffic counts over the past year and a 17 per cent increase over the past five years.
“In terms of traffic count growth, the Southern Suburbs (including Ripley, Raceview, Flinders View) maintained the highest one year percentage growth rate of 10 per cent,” he said.
“The Eastern Suburbs (including Redbank, Goodna, Collingwood Park) had the highest five year percentage growth rate of 29 per cent, just above the Southern Suburbs and Outer Eastern Suburbs (Springfield, Bellbird Park, Augustine Heights).
“Additionally, the Outer Eastern Suburbs observed the largest five year volume increase of 60,430 vehicles counts per weekday.”
Mr Dill said it was worth noting this year that the traffic volumes in the ‘Ipswich Central’ area continued to remain unchanged with 0 per cent growth measured over both the one and five year periods.
“The results have also identified that a number of two-lane roads within the city’s transport network continue to perform near or over their carrying capacity. Where necessary, these roads have already been identified for future investment by Council and prioritised as part of the annual prioritisation of projects for the Strategic Transport Sub-program within the Capital Works Portfolio.
“Finally, the results outlined in this report provide further evidence of the current population growth and development occurring in Ipswich and the need to deliver on the objectives of the City of Ipswich Transport Plan (iGO) in order to maintain a safe and reliable transport network.
“In particular, the continued high growth trend in vehicle trips provides justification for the need for Ipswich residents to be provided with access to viable and high quality public and active transport alternatives.”
5