
New electoral divisions have been set by Queensland’s Local Government Change Commission for Ipswich, which now has four divisions in total.
Ahead of the March 2020 local council election, Ipswich First will profile each of the divisions which will have two councillors representing each division after the election.
Each profile reports on data from the Australian Bureau of Statistics and .id the population experts.
The profiles provide a snapshot of community, workforce and household characteristics in each division compared to the city overall, and look at how local community characteristics have changed over the last two Census periods.
This is Division 1.
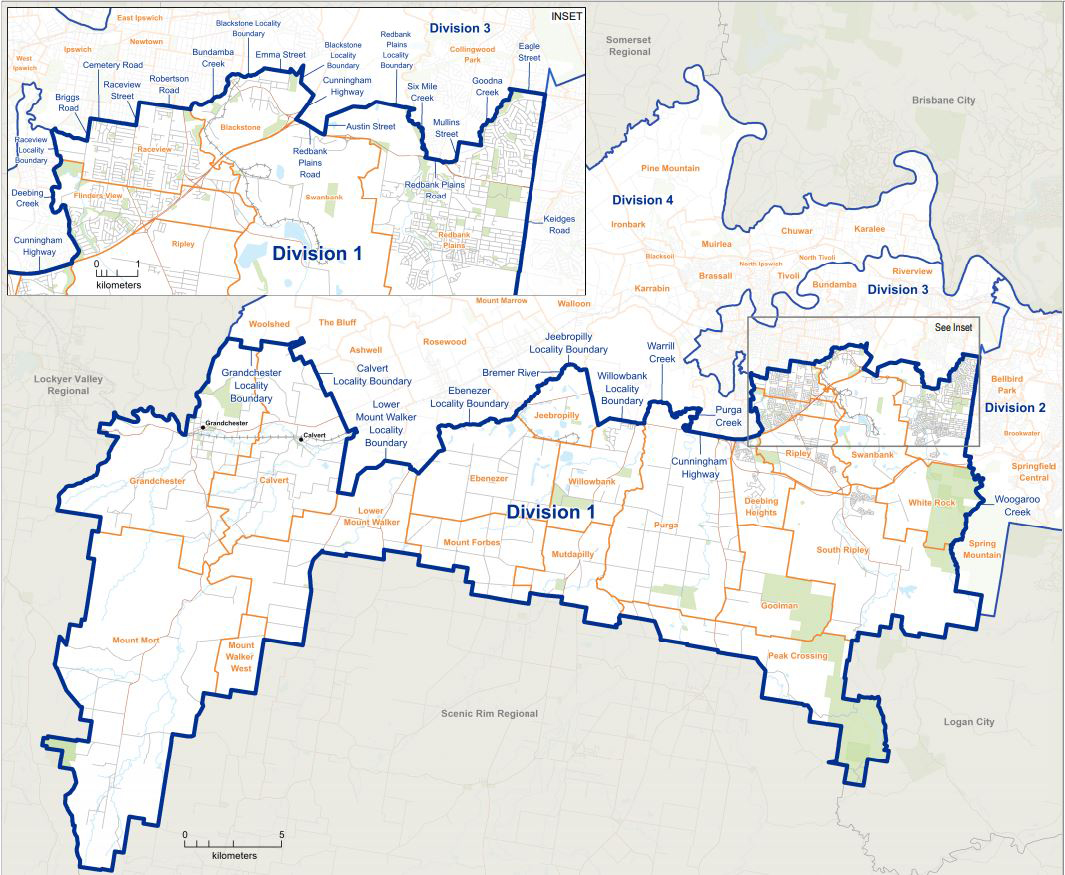
Suburbs of Division 1
Division 1 is the largest of the four divisions amalgamating both rural and urban suburbs across 611 Km2 from Grandchester and Mount Mort in the west to Redbank Plains and White Rock in the east.
The division contains areas with significant projected growth.
Over the 12 months to 2018, the division is estimated to have grown by five percent or 2,347 people which is above the three and a half percent population growth across the rest of the city.
The suburb of Redbank Plains is home to the largest share of the division’s population with 19,299 people, followed by Raceview with 9,721 people and Flinders View with 5,808 people.
The average household income was slightly higher in Division one than for Ipswich overall.
The highest averages recorded in Division 1 suburbs of Deebing Heights, Goolman, South Ripley.
Grandchester
Mount Mort
Mount Walker West
Lower Mount Walker
Calvert
Ebenezer
Mount Forbes
Jeebropilly
Willowbank
Mutdapilly
Purga
Peak Crossing
Goolman
Deebing Heights
Raceview
Flinders View
Ripley
South Ripley
White Rock
Swanbank
Blackstone
Redbank Plains
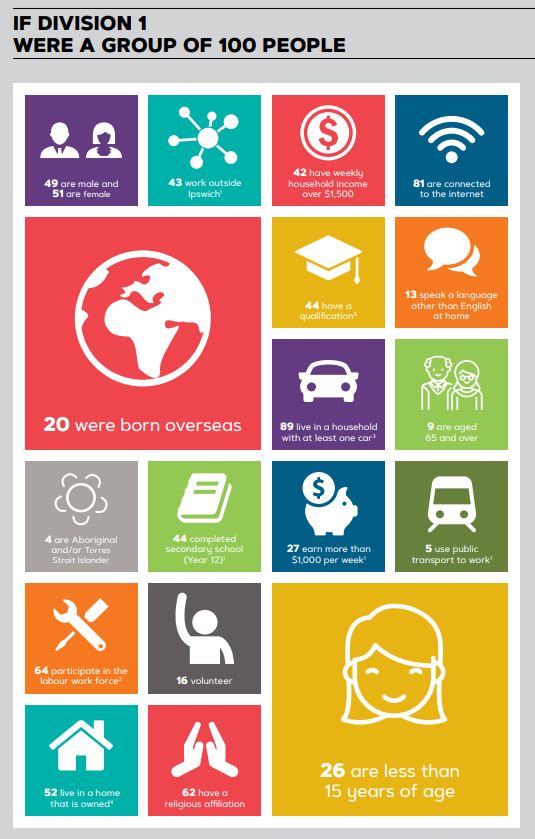
In 2016 Census, the total resident population for Division 1 was 43,651.
Of these, 21,418 were male and 22,204 were female representing a 49.1 per cent to 50.9 per cent respective gender split.
The total population of Division 1 in 2016 had a higher proportion of people aged under 15 years, 25.6 per cent, and a lower proportion of people aged 65 years and over at nine per cent.
Changes over the reporting period show a large increase in people aged 65 years and older in this division, indicating ageing in place and also older cohorts moving into the area.
Three-quarters of Division 1 households are family households which was a higher proportion than across Ipswich overall at 72 per cent.
This includes a higher proportion of couple families with children, and a similar proportion of one-parent families.
Division 1 is home to 1,747 residents, four per cent, who identified as Aboriginal and/or Torres Strait Islander in 2016.
In 2016, 8,639 of Division 1 residents were born overseas: an increase of 2,418 persons since 2011.
The largest non-English speaking country of birth in Division 1 was Samoa, where one and a half of a per cent of the population, or 688 people, were born.
The largest group of residents born overseas were New Zealanders.
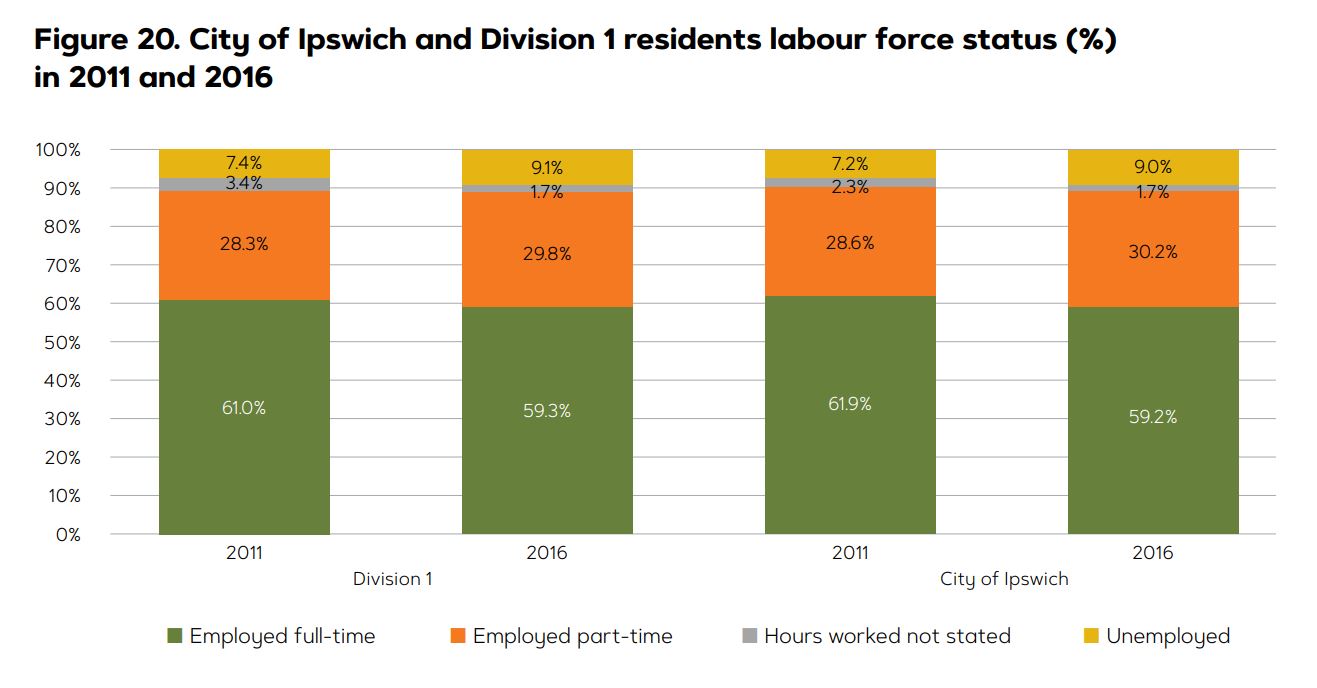
In 2016, there were 32,457 residents of working age in Division 1, including 20,744 that participated in the labour force, below Ipswich’s overall participation rate.
Of the Division 1 labour force:
- 12,304 people worked full-time
- 6,191 people worked part-time
- 1,891 were unemployed
The remaining 9,668 residents aged 15 years and over who were not in the labour force stated they were either studying, performing home duties, had a disability or were neither studying nor working.
More than half of the working residents in Division 1 are employed locally in Ipswich (11,441 people or 51.9 per cent) while 43.3 per cent travel outside of Ipswich for work. This is a smaller percentage than for the city overall (48.4%).
The top five employment industries for working residents of Division 1 in 2016 were Health Care and Social Assistance (12.7 per cent); Retail Trade (11.2 per cent); Manufacturing (10.4 per cent); Public Administration and Safety (9.2 per cent); and Construction (8.6 per cent).
Between 2011 and 2016, the most popular employment type in Division 1 changed from Manufacturing (dropping from 15 per cent of the employment share to 10.4 per cent) to Health Care and Social Assistance (increasing in employment share from 11.5 per cent to 12.7 per cent) being similar to the industry change for the city overall.
Division 1 shares a similar income distribution to Ipswich overall. In 2016, 26.9 per cent of residents aged 15 years and over earned more than $1,000 per week (compared to 27.9 per cent for Ipswich).
In 2016, 52.3 per cent of households in Division 1 had purchased or fully owned their home while 37.1 per cent were renting privately, and 2.6 per cent were in social housing in 2016.
Of Division 1 residents aged 15 years and over:
- 7,576 were in the lowest quartile earning less than $333 weekly
- 7,040 were in the medium lowest quartile earning $334 to $660 per week
- 9,031 were in the medium highest quartile earning $661 to $1,195 per week
- 6,112 were in the highest personal income quartile earning $1,196 and over