New electoral divisions have been set by Queensland’s Local Government Change Commission for Ipswich, which now has four divisions in total.
Ahead of the March 2020 local council election, Ipswich First will profile each of the divisions which will have two councillors representing each division after the election.
Each profile reports on data from the Australian Bureau of Statistics and .id the population experts.
The profiles provide a snapshot of community, workforce and household characteristics in each division compared to the city overall, and look at how local community characteristics have changed over the last two Census periods.
This is Division 2.
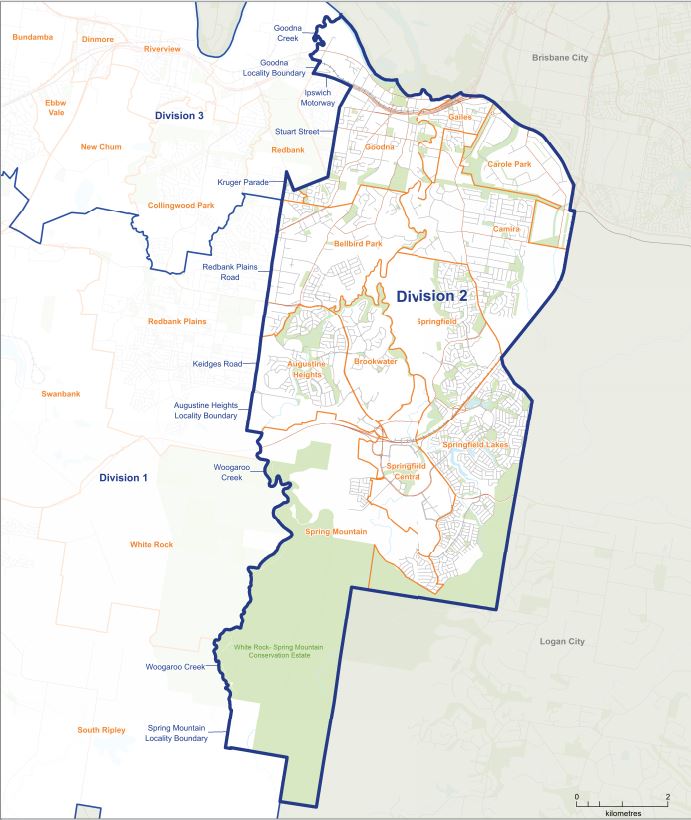
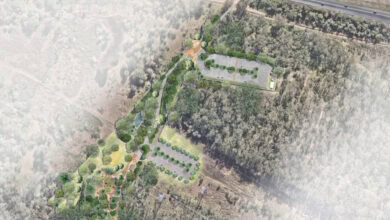
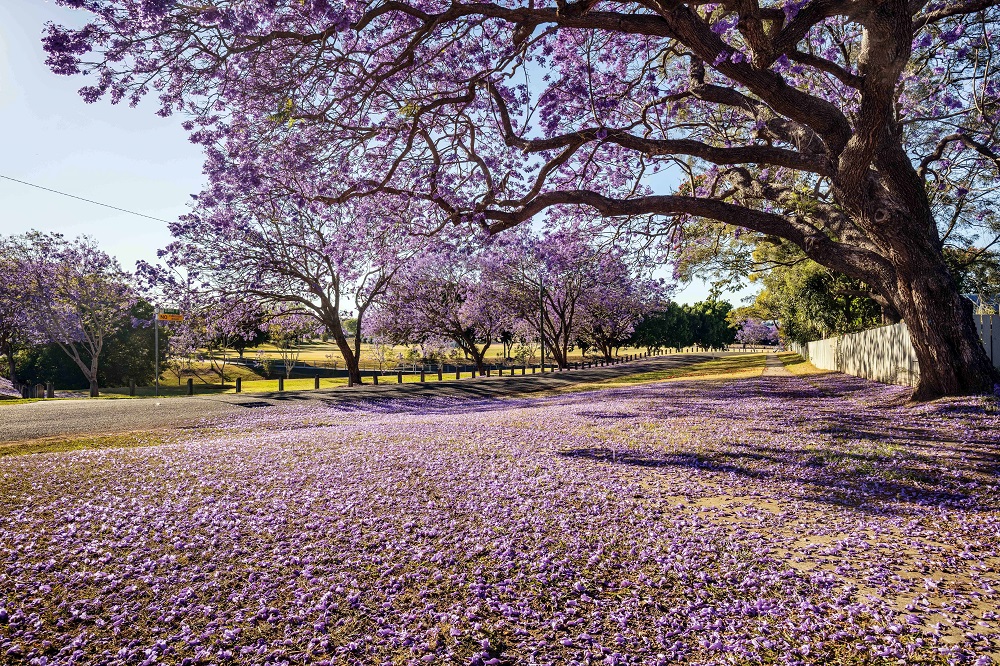
Division 2 is a mostly urban electorate situated in the eastern extent of Ipswich.
The division is bound by the Brisbane River in the north, Brisbane and Logan City boundaries in the east, White Rock Spring Mountain Conservation Estate in the south, and Woogaroo Creek and Redbank Plains Road in the west.
In 2018, the division had an estimated resident population of 62,515.
Division 2 contains a mix of established suburbs and developing suburbs and is estimated to have grown by four per cent or 2,301 people in the twelve months to 2018.
That is compared to three and a half per cent for the rest of Ipswich overall.
Division 2 wholly includes all suburbs except for Goodna and Redbank.
The complete inclusion of Goodna and Redbank was not possible as each council division is required to have relatively the same number of electors.
Suburbs of Division 2
Augustine Heights
Bellbird Park
Brookwater
Camira
Gailes
Goodna
Springfield
Springfield Central
Springfield Lakes
Redbank
(Division 2 wholly includes all suburbs except for Goodna and Redbank)
In 2016 Census, the total resident population for Division 2 was 55,952, of which 27,810 were male and 28,123 were female.
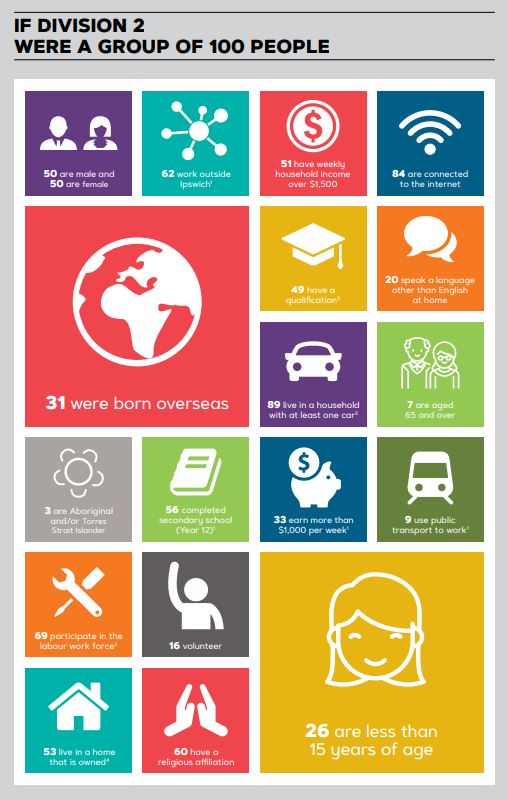
This represents a proportionate split of 49.7 per cent males and 50.3 per cent females in Division 2, which is similar to Ipswich as a whole.
More than three-quarters of Division 2 households are family households.
Division 2 has great diversity with residents from many different cultures, ages and social groups living within its boundaries.
Springfield Lakes had the largest population in 2016, followed by Goodna, Camira and Bellbird Park, while Gailes had the smallest population in Division 2.
The oldest suburb based on the population’s median age was Camira and the youngest suburb was Springfield Central (influenced by small population numbers).
Brookwater’s median household income of $2,961 per week eclipses all other suburbs within the division, being three times more than Gailes’ median of $982 per week.
Some suburbs within Division 2 showed a significant increase in population between 2011 and 2016.
Augustine Heights has been experiencing growth associated with new residential developments, resulting in an additional 2,904 persons or 147.3 per cent population growth between 2011 and 2016.
Development also continues at Springfield Lakes where the 2016 population has increased by more than half its size in 2011, that is 50 per cent or 5,162 persons.
In 2016, 17,210 or 30.8 per cent of Division 2 residents were born overseas which was a higher proportion than for the city as a whole on 20 per cent.
India was the largest non-English speaking country of birth in Division 2, where 2 per cent of the population or 1,101 people were born.
Compared to Ipswich as a whole, the Division 2 population had a larger percentage of people born in New Zealand (8.2 per cent compared to 5.6 per cent), United Kingdom (4.9 per cent compared to 3.8 per cent), and India (2 per cent compared to 1 per cent).
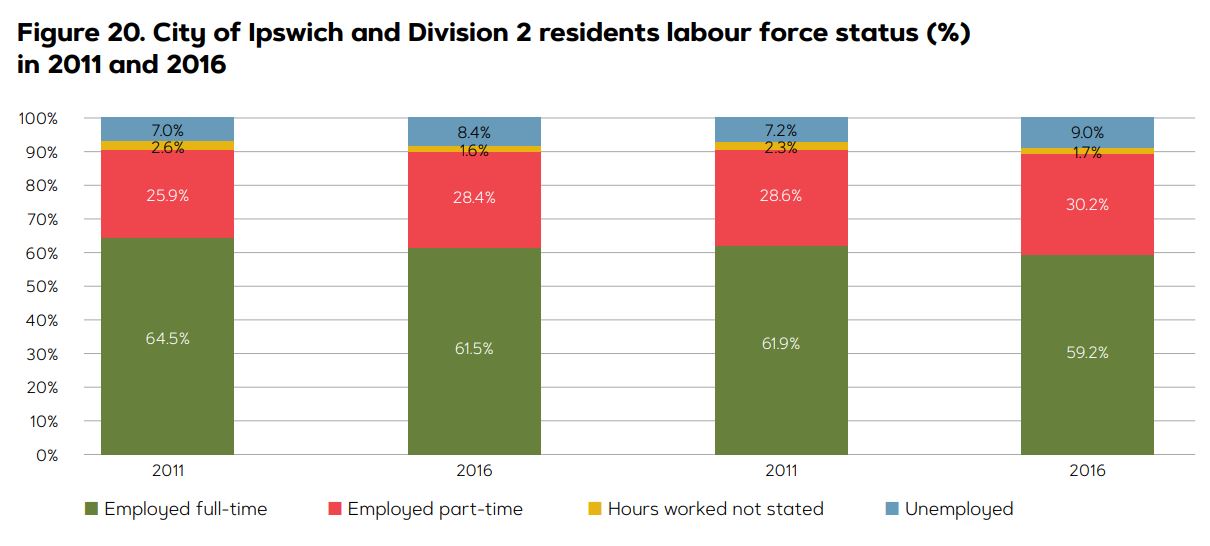
In 2016, there were 41,495 residents of working age in Division 2, including 28,719 (69.2 per cent) that participated in the labour force which is above the Ipswich average of 62.6 per cent.
Of the Division 2 labour force:
- 17,663 people worked full-time (61.5 per cent down from 64.5 per cent in 2011)
- 8,169 people worked part-time (28.4 per cent up from 25.9 per cent in 2011)
- 2,416 were unemployed (8.4 per cent, up from 7 per cent in 2011)
The remaining 10,106 residents (or 24.4 per cent) aged 15 years and over who were not in the labour force stated they were either studying, performing home duties, had a disability or were neither studying nor working.
Roughly one third of working residents in Division 2 are employed locally in Ipswich, 8,876 people or 33.8 per cent, while almost two thirds travel outside of Ipswich for work.
That is well above the city average of 48.4 per cent.
Division 2 has a smaller proportion of working residents in a job with no fixed address, 4.2 per cent compared to 4.5 per cent for Ipswich overall, meaning they travel regularly to different worksites.
The top five employment industries for working residents of Division 2 in 2016 were Health Care and Social Assistance, 12.8 per cent; Manufacturing, 10.1 per cent; Retail Trade, 9.9 per cent; Public Administration and Safety, 8.4 per cent and Construction, 8.2 per cent.
Between 2011 and 2016, the most popular employment type in Division 2 changed from Manufacturing (dropping from 15.2 per cent of the employment share in 2011 to 10.1 per cent in 2016) to Health Care and Social Assistance (increasing in employment share from 10.9 per cent in 2011 to 12.8 per cent in 2016).
In 2016, 13,717 working residents in Division 2 earned more than $1,000 per week, which was a higher proportion than for Ipswich overall (33.1 per cent compared to 27.9 per cent).
In 2016, 53.2 per cent of households in Division 2 had purchased or fully owned their home while 35.6 per cent were renting privately, and 3.3 per cent were in social housing in 2016.
Analysis of the working-age population by income quartile in Division 2 relative to Ipswich shows a greater proportion in the highest income quartile and a lower proportion in the lowest income quartile.
Of Division 2 residents aged 15 years and over:
- 9,412 earn less than $333 weekly
- 7,453 earn between $334 to $660 per week
- 11,033 earn between $661 to $1,195 per week
- 10,237 earn $1,196 and over
View the full Divisional profiles here.