
New electoral divisions have been set by Queensland’s Local Government Change Commission for Ipswich, which now has four divisions in total.
Ahead of the March 2020 local council election, Ipswich First will profile each of the divisions which will have two councillors representing each division after the election.
Each profile reports on data from the Australian Bureau of Statistics and .id the population experts.
The profiles provide a snapshot of community, workforce and household characteristics in each division compared to the city overall, and look at how local community characteristics have changed over the last two Census periods.
This is Division 3.
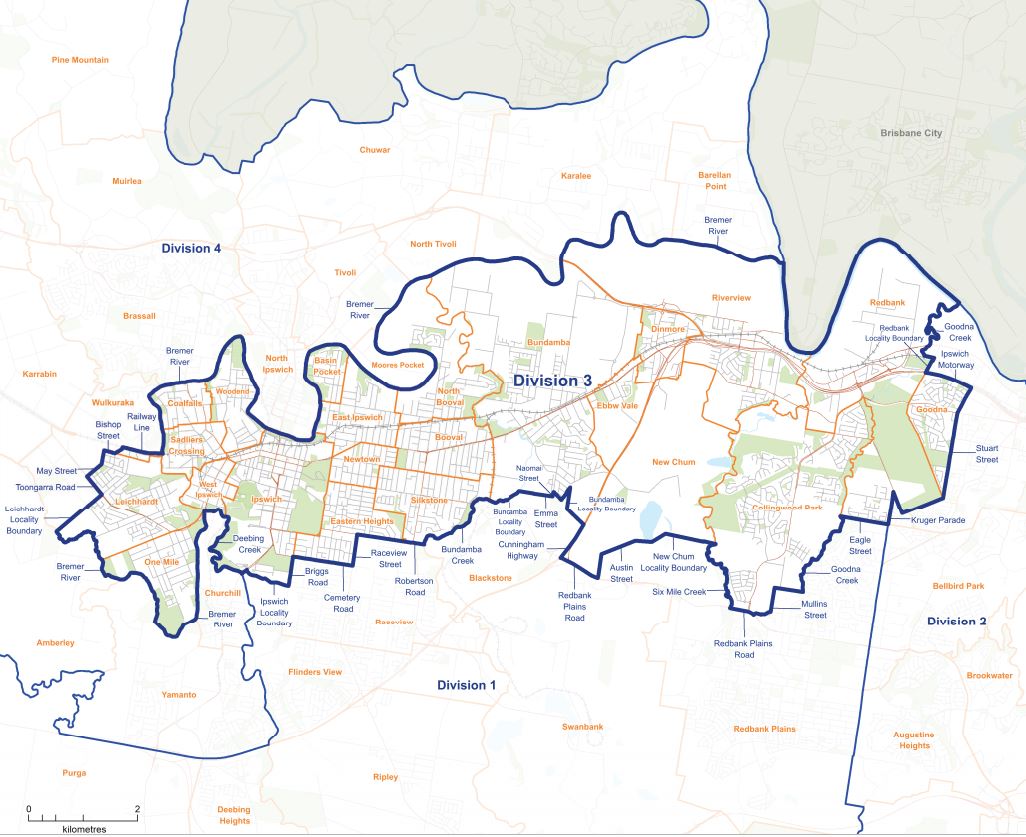
Division 3 contains many of the central Ipswich suburbs.
It is oriented in a west-east direction with Brisbane Road and the Ipswich train line through its core.
The western extent is Leichardt and One Mile, with the northern extent of the division largely bound by the Bremer and Brisbane Rivers.
The southern boundary follows Bundamba Creek north of Blackstone, the Cunningham Highway and Redbank Plains Road.
The eastern extent is bordered by Goodna Creek, the Ipswich Motorway and Stuart Street.
The estimated resident population in 2018 was 53,269 people.
In the 12 months to 2018, the population of Division 3 increased by 1.4 per cent (compared to 3.5 per cent for Ipswich overall).
As suburbs within Division 3 are mostly well established, population growth is expected to be stable, and much slower compared to new development areas of Ipswich.
Suburbs of Division 3
One Mile
Leichhardt
Coalfalls
Sadliers Crossing
West Ipswich
Woodend
Ipswich
Basin Pocket
East Ipswich
Newtown
Eastern Heights
Silkstone
Booval
North Booval
Bundamba
Ebbw Vale
New Chum
Dinmore
Riverview
Collingwood Park
It also includes a part of Wulkuraka that lies south of the railway line
Most of Redbank excluding those houses situated east of Kruger Parade
Part of Goodna that falls west of Stuart Street.
The complete inclusion of Goodna, Wulkuraka and Redbank was not possible as each council division is required to have relatively the same number of electors.
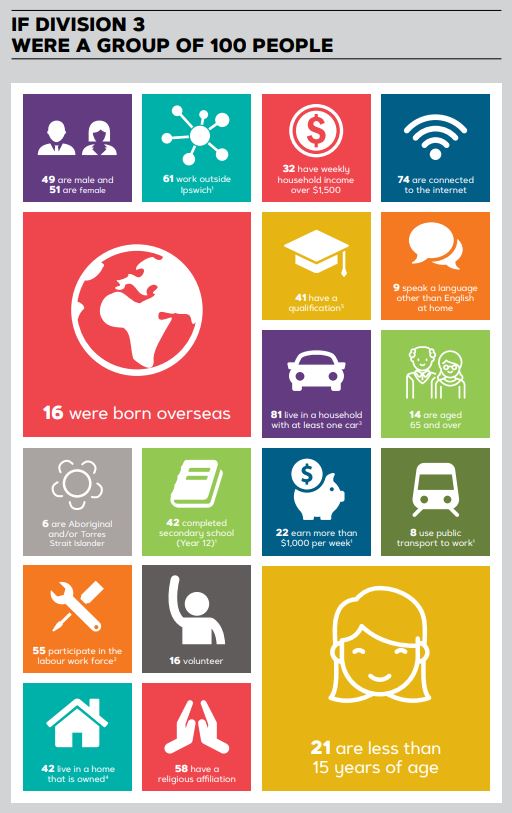
In 2016 Census, the total resident population for Division 3 was 50,150.
Of these, 24,703 were male and 25,463 were female.
This is similar to Ipswich, with a slightly higher ratio of females to males.
As Division 3 comprises many well-established suburbs, it also comprises a diversity of age groups, socioeconomic groups and cultures within its boundaries.
At the 2016 Census, Division 3 had an older median age relative to Ipswich as a whole – 35 years compared to 32 years.
The Division 3 suburbs of Ebbw Vale, Booval and Eastern heights had an average age above this (46 years, 42 years and 41 years respectively), while the youngest average age was in Goodna, Leichardt, North Booval and Collingwood Park (30 years).
Collingwood Park was the only Division 3 suburb to have a median weekly household income above the city average ($1,507 per week compared to $1,408 for the City of Ipswich), which was 1.5 times the average household income in Booval, Riverview, Leichardt, Dinmore, Ipswich, One Mile and Redbank.
Between 2011 and 2016, the population of Division 3 increased by 1,262 people (an annual average population change of 0.5 per cent). This growth rate is well below the average for the City of Ipswich at 3.2 per cent per annum.
This limited population change can be a reflection of the long established suburbs in Division 3, and an older demographic ageing in place.
In 2016, Division 3 had a larger proportion of the population aged 65 years and over (13.9 per cent which is above 10.7 per cent for the rest of Ipswich) and a smaller proportion of its population under the age of 15 years (21.4 per cent compared with 23.7 per cent for Ipswich as a whole).
Lone persons households represent more than a quarter of the division’s household composition (25.5 per cent compared to 19.0 per cent for the rest of Ipswich).
This would in part be attributed to the division’s older demographic.
The higher percentage of single person households may also be attributed to increased housing density in central Ipswich and a higher percentage of single person dwellings being rented as social housing.
In 2016, 16.1 per cent of Division 3 residents were born overseas being a lower proportion than the City of Ipswich’s proportion of 20.1 per cent.
Division 3 is home to 2,919 residents (5.8 per cent) who identified as Aboriginal and/or Torres Strait Islander in 2016.
This is a higher proportion than the Ipswich average (4.4 per cent).
Between 2011 and 2016, the number of residents identifying as Aboriginal and/or Torres Strait Islander increased by 508 persons (a proportionate increase of 0.9 per cent), which is considerable given the limited population change of the division, and relative to the rest of Ipswich’s proportional increase (0.6 per cent).
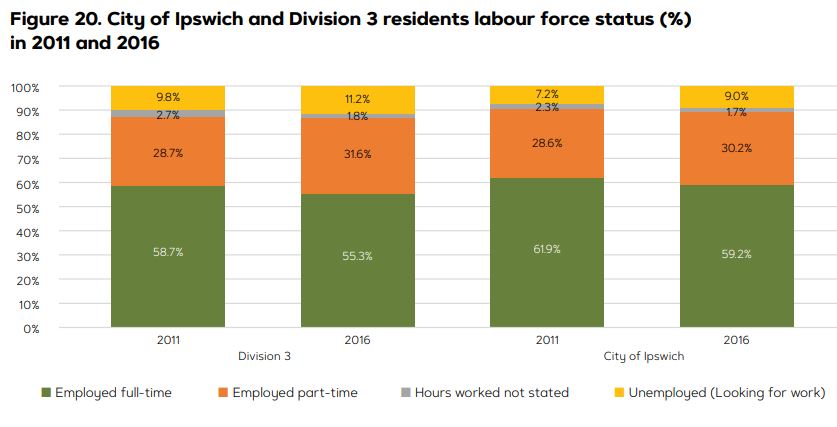
Division 3 had 39,448 residents who are working aged, with 21,836 residents in the labour force (or 55.4 per cent, below the average participation rate for the City of Ipswich, 62.6 per cent).
Of the Division 3 labour force:
- 12,086 persons worked full-time (55.3 per cent down 1.7 per cent since 2011)
- 6,904 persons worked part-time (31.6 per cent up 1.3 per cent since 2011)
- 2,452 were unemployed (11.2 per cent up from a 9.8 per cent unemployment rate in 2011)
Of these residents, 1,635 were seeking full time work and 817 stated they were seeking part-time work.
The division’s unemployment rate increased by 1.4 percentage points since 2011, which represents a lower growth in unemployment than that experienced in Ipswich overall (up 1.8 percentage points since 2011).
Over sixty percent of Division 3’s working residents are employed outside of Ipswich, which is a well above the city’s average of 48.4 per cent.
Just 35 per cent of the working population in Division 3 were employed locally compared to 47.5 per cent for Ipswich as a whole).
In 2016, more working residents of Division 3 worked in Health Care and Social Assistance than any other industry.
Other key industries of employment for Division 3 residents included Retail Trade and Manufacturing.
This industry profile for Division 3 workers takes in the Ipswich Hospital, the Ipswich Health Plaza, the TAFE Queensland Ipswich Campus and the University of Southern Queensland, in addition to a concentration of local primary and secondary schools.
Central Ipswich is also a hub for manufacturing and related service industries.
Compared to Ipswich as a whole, Division 3 had a smaller proportion of working residents earning a high income and a larger proportion of residents on low incomes.
Of Division 3 population aged 15 years and over:
- 9,378 earn less than $333 weekly
- 10,375 earn $334 to $660 per week
- 9,512 earn between $661 to $1,195 per week
- 6,179 earn $1,196 and over
In 2016, 50.3 per cent of households in Division 3 had purchased or owned their home and 33.1 per cent were renting privately, with another 6.4 per cent in social housing.
Compared to the City of Ipswich, Division 3 had a larger proportion of households who owned their dwelling, a smaller proportion purchasing their dwelling and larger proportion of renters, including a larger proportion of social housing.
View the full Divisional profiles here.
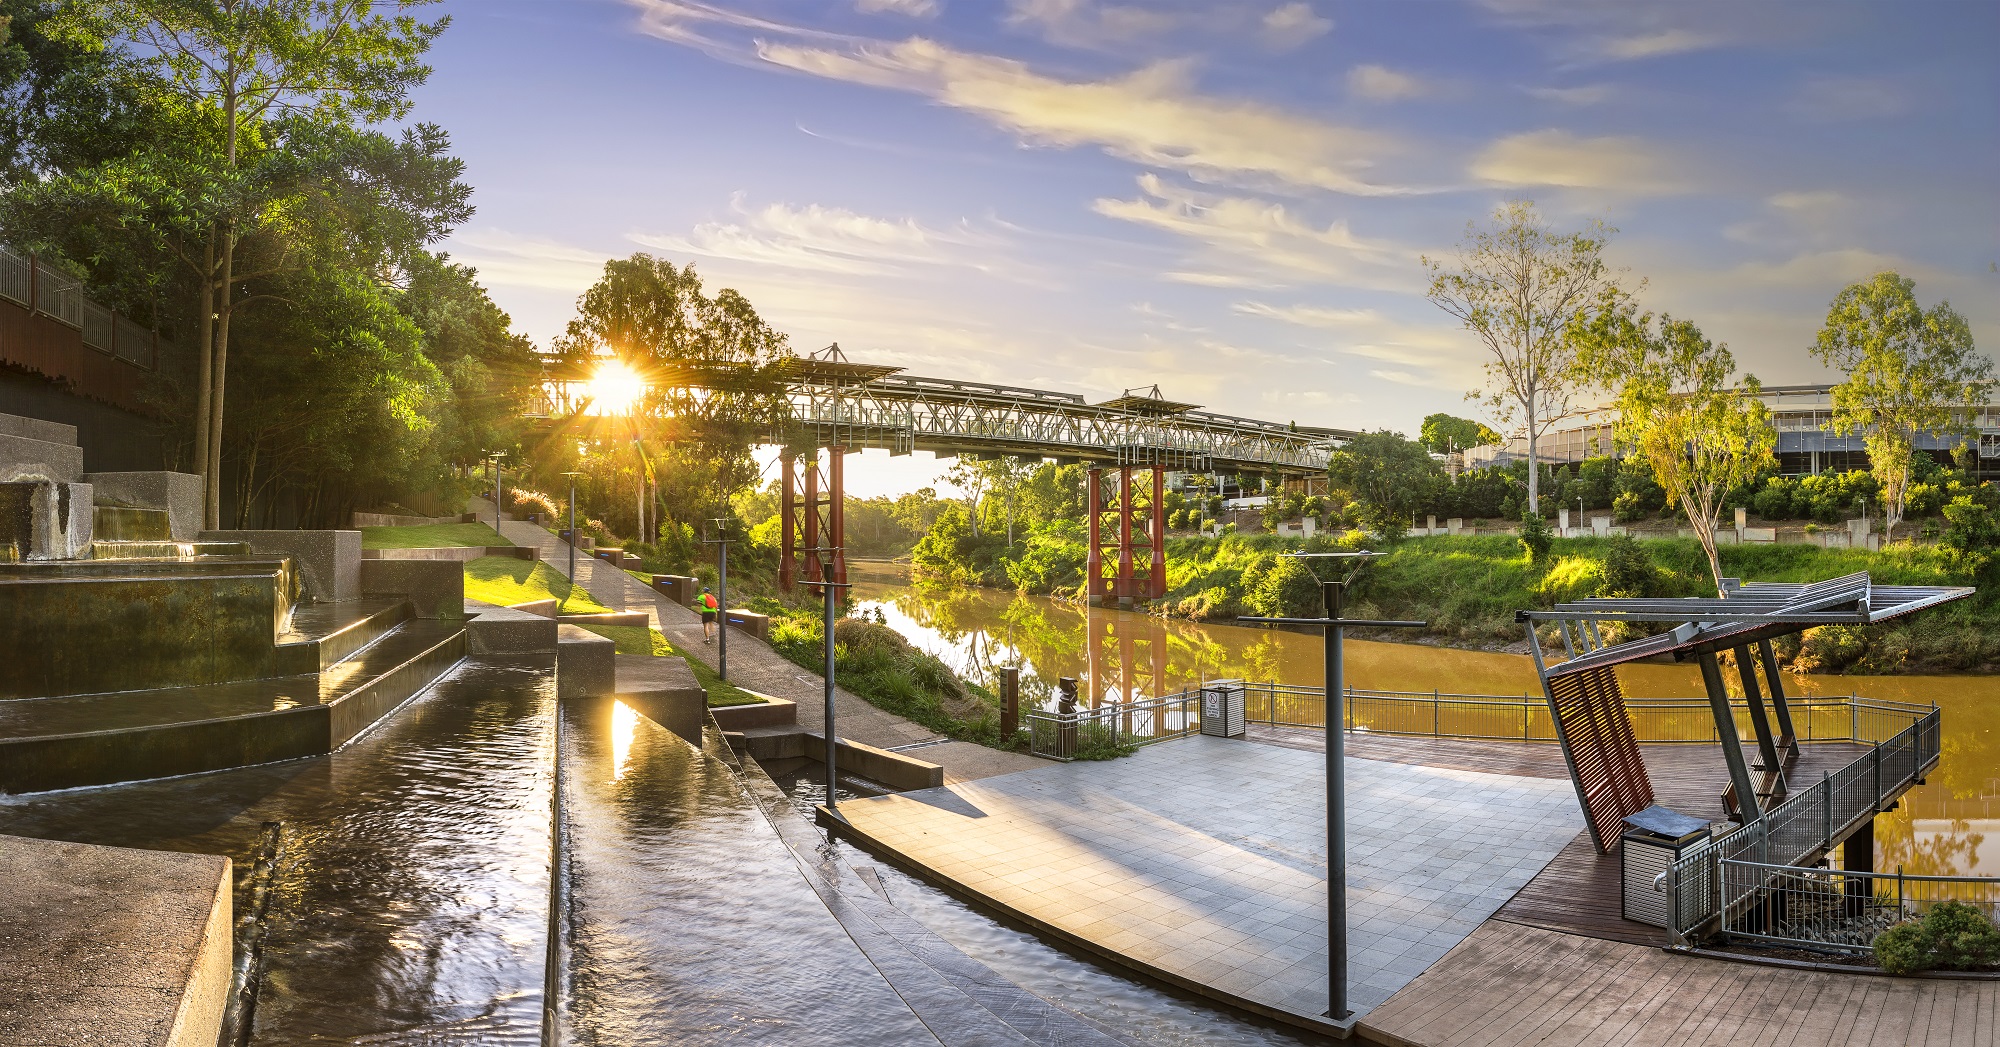
That photo of Riverheart Parklands is beautiful. However, in reality it’s very rundown and badly needs maintenance. I go walking there almost every day and am sad to see it as it is right. It began so well. Even a minor clean up would do. And…the sign at Kholo Park that says council is ‘working’ on it (a nice part of the walk a bit further in) has been there for so many years that it starts fading. Maybe some work is done in the minds of good people but not anything practical. Let’s keep Ipswich beautiful!